

We analysed 51.6 million unique coupon codes issued through the Uniqodo platform between January and June 2026, covering 90 merchants and 4,124 promotions across travel, retail and telco. The dataset includes 11.7 million validations and 1.79 million redemptions.
The data shows substantial differences in conversion rate, average order value and redemption behaviour by sector, discount percentage, promotion type and distribution channel. We also looked at how quickly codes are redeemed and how redemption patterns change by day and month.
Here are the key findings from the H1 2026 data before we look at each area in more detail.
Key coupon code statistics from H1 2026
Based on Uniqodo platform data from 90 merchants and 4,124 promotions between January and June 2026.
- 15.29% of validated coupon codes converted to a redemption across 90 merchants and 4,124 promotions on the Uniqodo platform in H1 2026.
- Retail and fashion converted validated codes at more than twice the rate of telco: 17.81% versus 8.04%. Travel converted 13.74%.
- Retail discounts of 10% or less converted 22.30% of validated codes, compared with 9.08% at 20%.
- In travel, 15% discounts returned the highest average order value at £2,778, while discounts of 30% or more converted 71.77% but returned £234 per redemption.
- Fixed discounts converted 36.71% of validated codes in retail compared with 12.33% in travel, while average order value was £112 and £3,114 respectively.
- Travel onsite promotions averaged £5,831 per redemption compared with £856 for API-distributed promotions.
- 44.1% of non-batch coupon redemptions occurred within the first hour of issue, based on 572,433 redemptions.
- January accounted for 22.4% of H1 redemptions, while validated-to-redeemed conversion increased from 12.52% in January to 17.40% in June.
What is a good coupon code conversion rate?
There is no single coupon code conversion rate that can be used across every benchmark, because different reports use different denominators. Across 90 merchants and 4,124 promotions on the Uniqodo platform in H1 2026, 15.29% of validated codes converted to a redemption.
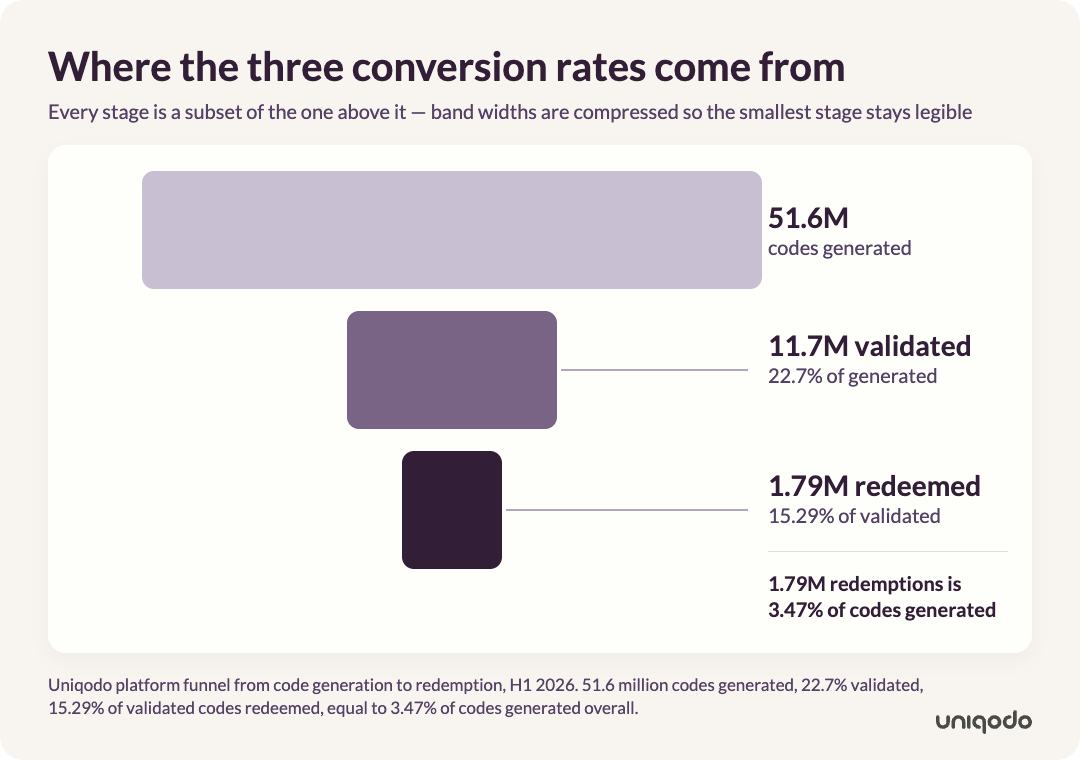
Three different rates get called a coupon conversion rate, and they measure three different things. Results from our platform showed the following:
- 3.47% of issued codes were redeemed. 1.79 million redemptions against 51.6 million codes issued, which is 28.8 codes issued for every redemption.
- 22.7% of issued codes were validated, meaning entered and applied to a basket. Uniqodo reporting calls this engagement rate.
- 15.29% of validated codes were redeemed. 1.79 million redemptions against 11.7 million validations. This is what conversion rate means throughout this report.
Which coupon conversion rate should you use?
For merchants measuring what happens after a code has been successfully applied, validated-to-redeemed is the most useful conversion rate. It starts at the point where the shopper has entered a valid code and the discount is live in the basket. If the order does not complete from there, the merchant can investigate the offer, basket or checkout rather than code distribution.
On the Uniqodo platform, that rate was 15.29% in H1 2026, ranging from 8.04% in telco to 17.81% in retail and fashion.
The issued-to-validated rate is useful alongside it because it answers a different question: how many issued codes were actually entered and applied to a basket. On the platform, that figure was 22.7%.
Why coupon conversion rates differ
The biggest difference between published coupon conversion rates is often the denominator.
In the Uniqodo dataset, 28.8 codes were issued for every redemption. Because merchants generate codes in different ways and volumes, a redemption rate calculated against all issued codes is heavily influenced by code-generation and distribution practices.
For example, generating two million codes instead of one million would halve the issued-to-redeemed rate if redemption volume stayed the same. That is why a rate calculated against issued codes should not be compared directly with a validated-to-redeemed conversion rate.
Coupon code conversion rates by sector
Uniqodo platform data, H1 2026. Sector attribution covers 99.5% of platform redemptions.
- Retail and fashion converted 17.81% of validated codes, on 4.9 million validations
- Travel converted 13.74%, on 6.4 million validations
- Telco converted 8.04%, on 333,000 validations
- Retail converted 2.2x better than telco, and the platform average of 15.29% sits between retail and travel.
The spread between sectors is large enough that a single platform-wide conversion benchmark has limited value on its own. A retailer comparing itself with telco, for example, would be comparing very different purchase journeys and customer decisions.
How to benchmark coupon conversion rates by sector
The most useful benchmark is within sector first, then by promotion type, discount percentage and distribution channel.
Across the Uniqodo platform in H1 2026, the overall validated-to-redeemed conversion rate was 15.29%, but that average combines sectors ranging from 8.04% in telco to 17.81% in retail and fashion. Merchants should therefore compare their performance against businesses with similar purchase journeys rather than relying on the platform-wide average alone.
What discount percentage performs best?
There is no single discount percentage that performs best across sectors. In retail and fashion, discounts of 10% or less had the highest conversion rate among the grouped bands at 22.30%. In travel, conversion increased sharply above 15%, but average order value fell as discounts deepened.
Retail coupon conversion and average order value by discount percentage
Source: Uniqodo platform data, H1 2026. Figures cover retail and fashion redemptions where discount percentage was recorded.
20% is the most common retail discount band, but has the lowest conversion rate
In retail and fashion, 20% discounts account for 34.1% of redemptions where discount percentage was recorded, making it the largest band in the dataset. Yet it has the lowest validated-to-redeemed conversion rate at 9.08%, compared with 22.30% for discounts of 10% or less.
Average order value tells a different story. It falls to £125 at 20% before rising to £227 at discounts of 25% or more. The clearest trade-off in the retail data is therefore between the higher conversion associated with discounts of 10% or less and the larger average order value associated with the deepest discount band.
Travel coupon conversion and average order value by discount percentage
Source: Uniqodo platform data, H1 2026. Figures cover travel redemptions where discount percentage was recorded.
15% discounts have the highest travel average order value
In travel, 15% discounts account for 72.1% of redemptions where discount percentage was recorded and have the highest average order value at £2,778. Their validated-to-redeemed conversion rate is 12.87%.
Above 15%, the relationship reverses. Conversion rises to 13.18% at 20%, 33.54% at 25% and 71.77% at 30% or more, while average order value falls to £550, £369 and £234 respectively. Deeper travel discounts are therefore associated with higher conversion but substantially smaller bookings.
Which coupon promotion type performs best?
There is no single coupon promotion type that performs best across every sector. In retail and fashion, product discounts recorded the highest validated-to-redeemed conversion rate at 39.06%, while fixed discounts led telco at 41.07%. In travel, percentage discounts converted best at 15.39%, while fixed discounts returned a higher average order value of £3,114.
Promotion type was recorded for 100% of retail and fashion redemptions, 99.0% of travel redemptions and 87.3% of telco redemptions.
Retail and fashion coupon performance by promotion type
Source: Uniqodo platform data, H1 2026.
In retail and fashion, product discounts recorded the highest conversion rate at 39.06%, followed by fixed discounts at 36.71% and multi-tier promotions at 31.64%. Percentage discounts converted at 12.41%, despite accounting for 51.8% of retail redemptions.
Travel coupon performance by promotion type
Source: Uniqodo platform data, H1 2026.
In travel, percentage discounts recorded the highest conversion rate at 15.39% and accounted for 50.5% of redemptions. Fixed discounts converted at 12.33% but returned a higher average order value of £3,114, compared with £2,348 for percentage discounts.
Multi-tier promotions had the highest travel AOV at £4,206, but accounted for just 1.0% of travel redemptions.
Telco coupon conversion by promotion type
Source: Uniqodo platform data, H1 2026. Order value was not sufficiently reported to be able to be included for this comparison.
In telco, fixed discounts recorded the highest conversion rate at 41.07%, compared with 14.12% for multi-tier promotions and 5.47% for percentage discounts. Fixed discounts accounted for 14.6% of telco redemptions.
How promotion type performance varies by sector
Fixed discounts show how sharply promotion performance can vary by sector. They converted 36.71% of validated codes in retail and fashion compared with 12.33% in travel. Average order value moved in the opposite direction: £112 in retail and £3,114 in travel.
Multi-tier promotions show a similar split, converting 31.64% in retail at £53 AOV and 12.79% in travel at £4,206 AOV.
Across the platform, multi-tier promotions accounted for 15.8% of redemptions but 2.9% of reported order value, while fixed discounts accounted for 30.1% of redemptions and 52.0% of reported order value.
Which coupon distribution channel performs best?
There is no single coupon distribution channel that performs best across every sector. In travel, API-distributed promotions had the highest conversion rate at 24.80%, while onsite promotions returned the highest average order value at £5,831. In retail and fashion, API converted best at 20.54%, while onsite had the highest AOV at £244.
Channel was recorded for 60.9% of platform redemptions in H1 2026, including 71.2% of travel redemptions, 49.1% of retail and fashion redemptions, and 100% of telco redemptions. These figures therefore describe attributed channel performance rather than all platform distribution.
Travel coupon performance by distribution channel
Source: Uniqodo platform data, H1 2026. Channel was recorded for 71.2% of travel redemptions.
In travel, API-distributed promotions recorded the highest conversion rate at 24.80%, compared with 16.04% for onsite promotions. Onsite promotions, however, returned an average order value of £5,831 per redemption, 6.8 times the £856 recorded for API.
Travel email converted at 24.03% and returned £2,960 per redemption, but accounted for just 0.8% of travel redemptions.
Retail and fashion coupon performance by distribution channel
Source: Uniqodo platform data, H1 2026. Channel was recorded for 49.1% of retail and fashion redemptions.
In retail and fashion, API had the highest conversion rate at 20.54%, followed by onsite at 18.60% and batch at 16.49%. Email accounted for 17.1% of retail redemptions where channel was attributed, yet had the lowest conversion rate at 7.67%.
Telco coupon conversion by distribution channel
Source: Uniqodo platform data, H1 2026. Channel was recorded for 100% of telco redemptions. Order value was not sufficiently reported for channel comparison.
In telco, onsite promotions converted 36.28% of validated codes, compared with 13.05% for batch and 6.94% for API. API accounted for 75.9% of telco redemptions, while onsite represented 6.8%.
How channel performance varies by sector
The largest channel difference appears in travel order value. Onsite promotions averaged £5,831 per redemption compared with £856 for API, while the equivalent retail figures were £244 and £164.
Conversion tells a different story. API converted best in both travel and retail, at 24.80% and 20.54% respectively, while onsite led telco at 36.28%.
Email performance also varies sharply by sector. In retail it converted 7.67% of validated codes and accounted for 17.1% of attributed redemptions. In travel it converted 24.03%, but represented only 0.8% of redemptions.
How quickly are coupon codes redeemed?
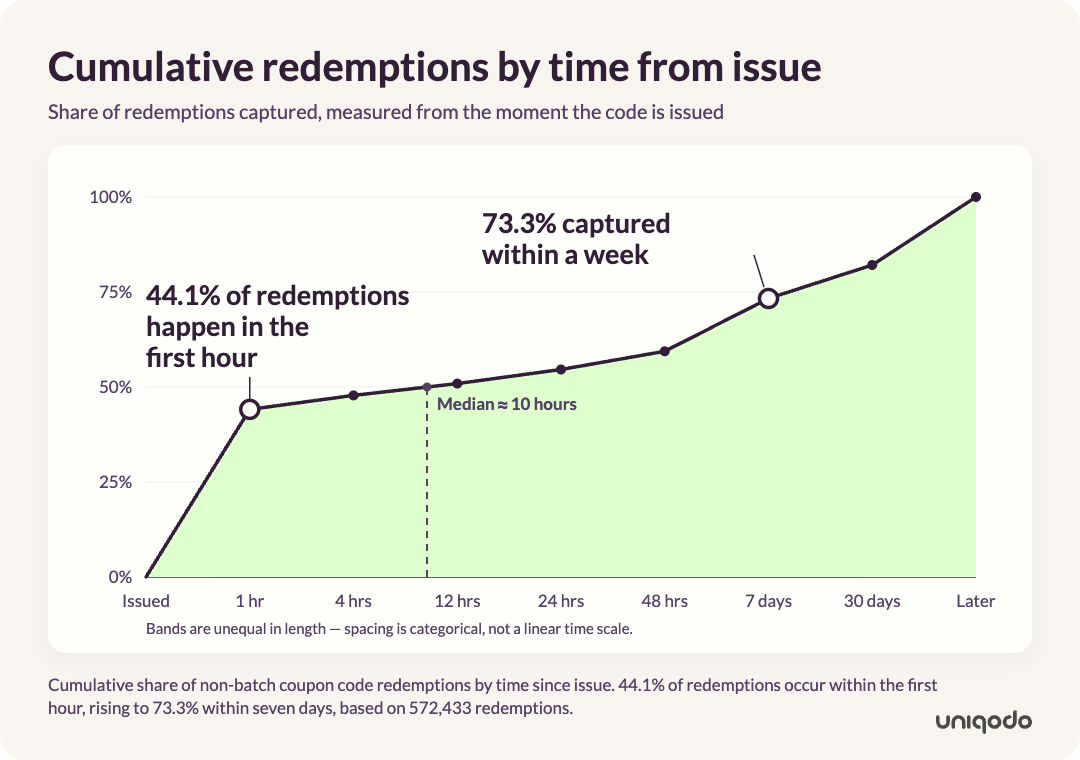
Coupon codes are often redeemed very quickly. Across 572,433 non-batch redemptions on the Uniqodo platform in H1 2026, 44.1% were redeemed within the first hour of issue and the median time to redemption was 10 hours. However, 26.7% of redemptions arrived more than seven days later.
Coupon code redemption time
Source: Uniqodo platform data, H1 2026, based on 572,433 non-batch redemptions.
44.1% of non-batch redemptions occurred within the first hour of issue, and 54.6% had been redeemed within 24 hours. By seven days, the cumulative share reached 73.3%.
The 13.9% recorded between two and seven days can look like a second peak when viewed as a band, but that interval spans 120 hours. On a per-hour basis, redemption activity continues to decline after the first hour.
Only 10.5% of non-batch redemptions land between the one-hour and 24-hour marks. The remainder splits between the first hour and the days that follow.
Why batch promotions are excluded
Batch-distributed promotions are excluded from all redemption-time figures because codes can be issued well before they are actually released to shoppers. Including batch promotions raises the median time from issue to redemption from 10 hours to 319 hours, or 13.3 days, because the measured gap includes distribution delay as well as shopper behaviour.
Every timing figure on this page is therefore stated on a non-batch basis.
Coupon code redemption time by sector
Source: Uniqodo platform data, non-batch redemptions only.
Travel had the fastest median redemption time at four hours, followed by telco at five hours and retail and fashion at 15 hours. However, retail had the highest seven-day redemption rate at 81.5%, compared with 71.6% in telco and 64.8% in travel.
Travel also had the longest late-redemption tail: 35.2% of non-batch travel redemptions occurred more than seven days after issue.
In retail and fashion, cumulative redemption rises from 53.6% within 24 hours to 60.3% within 48 hours, a 6.7 percentage-point increase. That makes the 24–48 hour period a potentially useful window to test reminder activity.
What this means for expiry windows
The redemption curve shows how much eventual redemption volume falls outside common expiry windows. A 24-hour expiry captures 54.6% of non-batch redemptions, 48 hours captures 59.4%, and seven days captures 73.3%.
The remaining 26.7% arrive after seven days, rising to 35.2% in travel.
Shorter expiry windows can still create urgency, but worth noting that they also exclude a meaningful share of redemptions that would otherwise happen later.
What day of the week do coupon code redemptions peak?
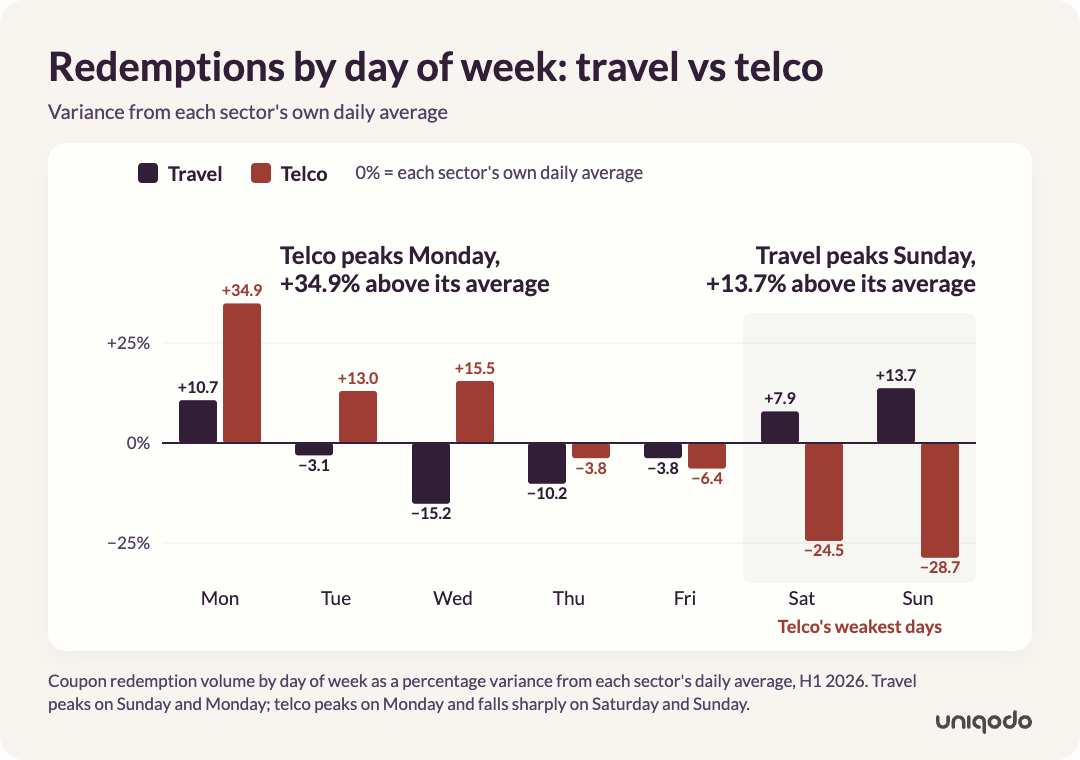
Coupon code redemption patterns differ sharply by sector. In travel, Sunday had the highest share of redemptions at 16.2%, 13.7% above the sector’s daily average. In telco, Monday was the strongest day at 19.3%, 34.9% above average.
Coupon code redemptions by day of week
Source: Uniqodo platform data. Figures cover travel and telco.
Travel’s weakest day is Wednesday at 12.1%, while telco’s second-strongest day is Wednesday at 16.5%.
What time of day do coupon code redemptions peak?
Travel and telco both peak between 12:00 and 15:00. That three-hour window accounts for 23.5% of travel redemptions and 25.0% of telco redemptions. Outside that window, the two sectors’ hourly profiles remain relatively similar, staying within 2.5 percentage points of each other in every three-hour band.
What coupon redemption timing means for campaign scheduling
Day of week appears to be more sector-specific than time of day. Travel redemptions are strongest on Sunday, Monday and Saturday, while telco peaks on Monday, Wednesday and Tuesday. By contrast, both sectors peak between 12:00 and 15:00.
For campaign planning, that suggests day-of-week timing should be benchmarked by sector rather than against a single overall pattern.
Coupon code redemption trends by month in H1 2026
January recorded the largest share of H1 coupon redemptions on the Uniqodo platform at 22.4%, while June accounted for 15.7%. Over the same period, validated-to-redeemed conversion increased from 12.52% in January to 17.40% in June.
Source: Uniqodo platform data, H1 2026.
Coupon code performance by month
Source: Uniqodo platform data. Monthly figures show each month’s share of H1 codes issued, validations and redemptions, plus validated-to-redeemed conversion rate.
The first three columns show each month's share of the half-year total for that metric. The final column shows each month's redemptions as a share of its own validations.
January had the highest redemption volume in H1 2026
January accounted for 22.4% of all H1 redemptions, the largest share of any month in the period. Redemption volume then fell to 13.0% of the H1 total in March before recovering to 15.7% in June. The busiest individual week was 9–15 February.
The January peak is notable because it occurs outside the major late-year retail promotional period, but this dataset does not identify the specific campaigns or behaviours driving that pattern.
Coupon validation volume fell while conversion rose
Validation volume was much higher at the start of H1, while conversion improved as the period progressed. January accounted for 27.6% of H1 validations and converted at 12.52%, compared with 13.8% of validations and a 17.40% conversion rate in June. In other words, fewer codes were being applied by the end of the period, but a higher share of those applications became completed orders.
Code generation moved differently again. May accounted for the largest share of H1 codes issued at 19.6%, but only 14.5% of redemptions, reinforcing why issued-to-redeemed rates are heavily influenced by issuance volume.
Coupon code statistics: common questions
What coupon code conversion rate should I benchmark against?
On the Uniqodo platform in H1 2026, 15.29% of validated coupon codes converted to a redemption across 90 merchants and 4,124 promotions. By sector, retail and fashion converted at 17.81%, travel at 13.74% and telco at 8.04%. These are validated-to-redeemed rates, so they should only be compared with benchmarks using the same denominator.
How quickly do people use coupon codes?
On the Uniqodo platform in H1 2026, 44.1% of non-batch coupon redemptions occurred within the first hour of issue and the median time to redemption was 10 hours. A further 26.7% arrived more than seven days later, including 17.9% after 30 days. Travel had the fastest median at four hours, while retail and fashion had the slowest at 15 hours.
What is the best discount percentage to offer?
There is no single best discount percentage across sectors. In retail and fashion, discounts of 10% or less converted 22.30% of validated codes, compared with 9.08% at 20%. In travel, conversion increased above 15%, but average order value peaked at £2,778 on 15% discounts and fell at deeper levels.
Do deeper discounts increase order value?
Not consistently. In retail and fashion, average order value falls to £125 at a 20% discount before rising to £227 at 25% or more, while conversion drops from 22.30% at discounts of 10% or less to 13.67% at 25% or more. In travel, average order value peaks at £2,778 on 15% discounts and falls at every deeper discount band.
Which coupon promotion type converts best?
The highest-converting promotion type varies by sector. In retail and fashion, product discounts converted 39.06% of validated codes, followed by fixed discounts at 36.71% and multi-tier promotions at 31.64%. In travel, percentage discounts converted highest at 15.39%, while fixed discounts returned a higher average order value of £3,114.
How long should a coupon code be valid for?
In Uniqodo’s H1 2026 non-batch redemption data, 54.6% of eventual redemptions occurred within 24 hours, 59.4% within 48 hours and 73.3% within seven days. In travel, 35.2% of redemptions arrived after seven days. Shorter expiry windows may still be useful for creating urgency, but the data shows that a significant share of redemptions happens after those windows have closed.
Where do these coupon statistics come from?
The figures come from Uniqodo platform records covering 90 merchants and 4,124 active promotions between 1 January and 30 June 2026. The dataset includes 51.6 million codes issued, 11.7 million validations and 1.79 million redemptions across travel, retail and fashion, and telco. The figures are based on live transactional records rather than consumer surveys.
About Uniqodo's promotional experience platform
The data in this report comes from promotions managed through the Uniqodo platform across 90 merchants and 4,124 active promotions in travel, retail and fashion, and telco.
The dataset spans percentage, fixed-value, product and multi-tier promotions, distributed through onsite experiences, APIs, email and batch campaigns. Managing those different promotion types through one platform gives Uniqodo a consistent view from code generation and validation through to redemption.
Uniqodo helps enterprise ecommerce brands create, distribute and control promotional offers across channels, with the rules and validation needed to manage promotions at scale.
Want to see how Uniqodo could support your promotion strategy? Get in Touch.

Julius Somoye
Founder & CTO