

The question “which discount type performs best?” has a different answer depending on who is asking. A retail trading manager and a travel commercial director can run the same mechanic and see very different results. This guide uses first-party redemption data to answer the question sector by sector: which discount format fits retail and fashion, which fits travel, which fits telco, and how to decide when your goal shifts. If you are choosing the best discount type for your industry, start with your commercial objective and let the format follow.
Why Is There No Single Best Discount Type by Industry?
The same discount format can perform very differently depending on the sector, so a format-first decision is the wrong starting point. This finding comes from Uniqodo's H1 2026 coupon code statistics, covering 90 merchants and 4,124 promotions on the Uniqodo platform between January and June 2026, with around 1.79 million redemptions in total.
One definition before the numbers: throughout this article, conversion rate means the share of validated codes that were redeemed. It does not mean sessions to orders.
Two examples show the split clearly:
- Fixed discounts converted 36.71% of validated codes in retail and fashion, with an average order value of £112. In travel, the same format converted 12.33% of validated codes but averaged £3,114 per redemption.
- Multi-tier discounts converted 31.64% of validated codes in retail and fashion at a £53 average order value, compared with 12.79% in travel at £4,206. The retail multi-tier result is heavily influenced by one large merchant's concentrated adoption at scale, as covered below.
Retail and fashion monetises promotions through conversion frequency, while travel monetises through basket size. Telco follows a different pattern again. Because the economics differ, teams need to choose formats by sector.
If You're in Retail and Fashion, Optimise for Conversion Frequency
For retail and fashion, the H1 2026 data supports judging promotions by how often validated codes turn into orders. Average order values across the four discount formats ranged from £53 to £161, while conversion rates varied substantially by format.
The formats rank as follows in retail and fashion:
- Product discounts converted best, at 39.06% of validated codes on £108 baskets. This is specifically a retail and fashion figure: 37,498 of the 37,513 product discount redemptions on the entire platform came from this sector. Treat it as a retail finding, not a general one.
- Fixed discounts converted 36.71% of validated codes across 114,596 redemptions, at £112 per order. A concrete saving on a basket below £200 is easy for a shopper to evaluate, which may help explain the conversion rate.
- Multi-tier discounts converted 31.64% of validated codes across 266,861 redemptions, at £53 per order. One large merchant's concentrated adoption at scale heavily influences that volume. This result shows that the format has worked at scale in at least one large implementation, but it is not necessarily a typical retail-wide pattern.
- Percentage discounts led on volume with 450,794 redemptions but had the lowest conversion rate, redeeming 12.41% of validated codes at £161 per order.

If your goal is order frequency, the data supports product-level and fixed discounts. Percentage discounts generated the most redemptions but converted a much smaller share of the codes shoppers validated. That distinction matters when each issued code represents a potential margin commitment. For a broader look at how retail brands structure offers, see Uniqodo's guide to promotions for retail brands.
If You're in Travel, Optimise for Basket Value
In the H1 2026 data, travel formats differed more clearly by booking value than by conversion rate. Conversion rates clustered within a narrow range, from 12.33% to 15.39% of validated codes across the three main formats. Average order values differed by nearly £2,000.
The travel results were:
- Multi-tier discounts were associated with the highest basket of any travel format, at £4,206 per redemption, although this result came from a smaller base of 9,269 redemptions across the period.
- Fixed discounts generated 419,157 redemptions at £3,114 per order and converted 12.33% of validated codes. The format combined high-value travel baskets with meaningful redemption volume.
- Percentage discounts converted best in travel at 15.39% of validated codes across 446,926 redemptions, with a £2,348 average order value.
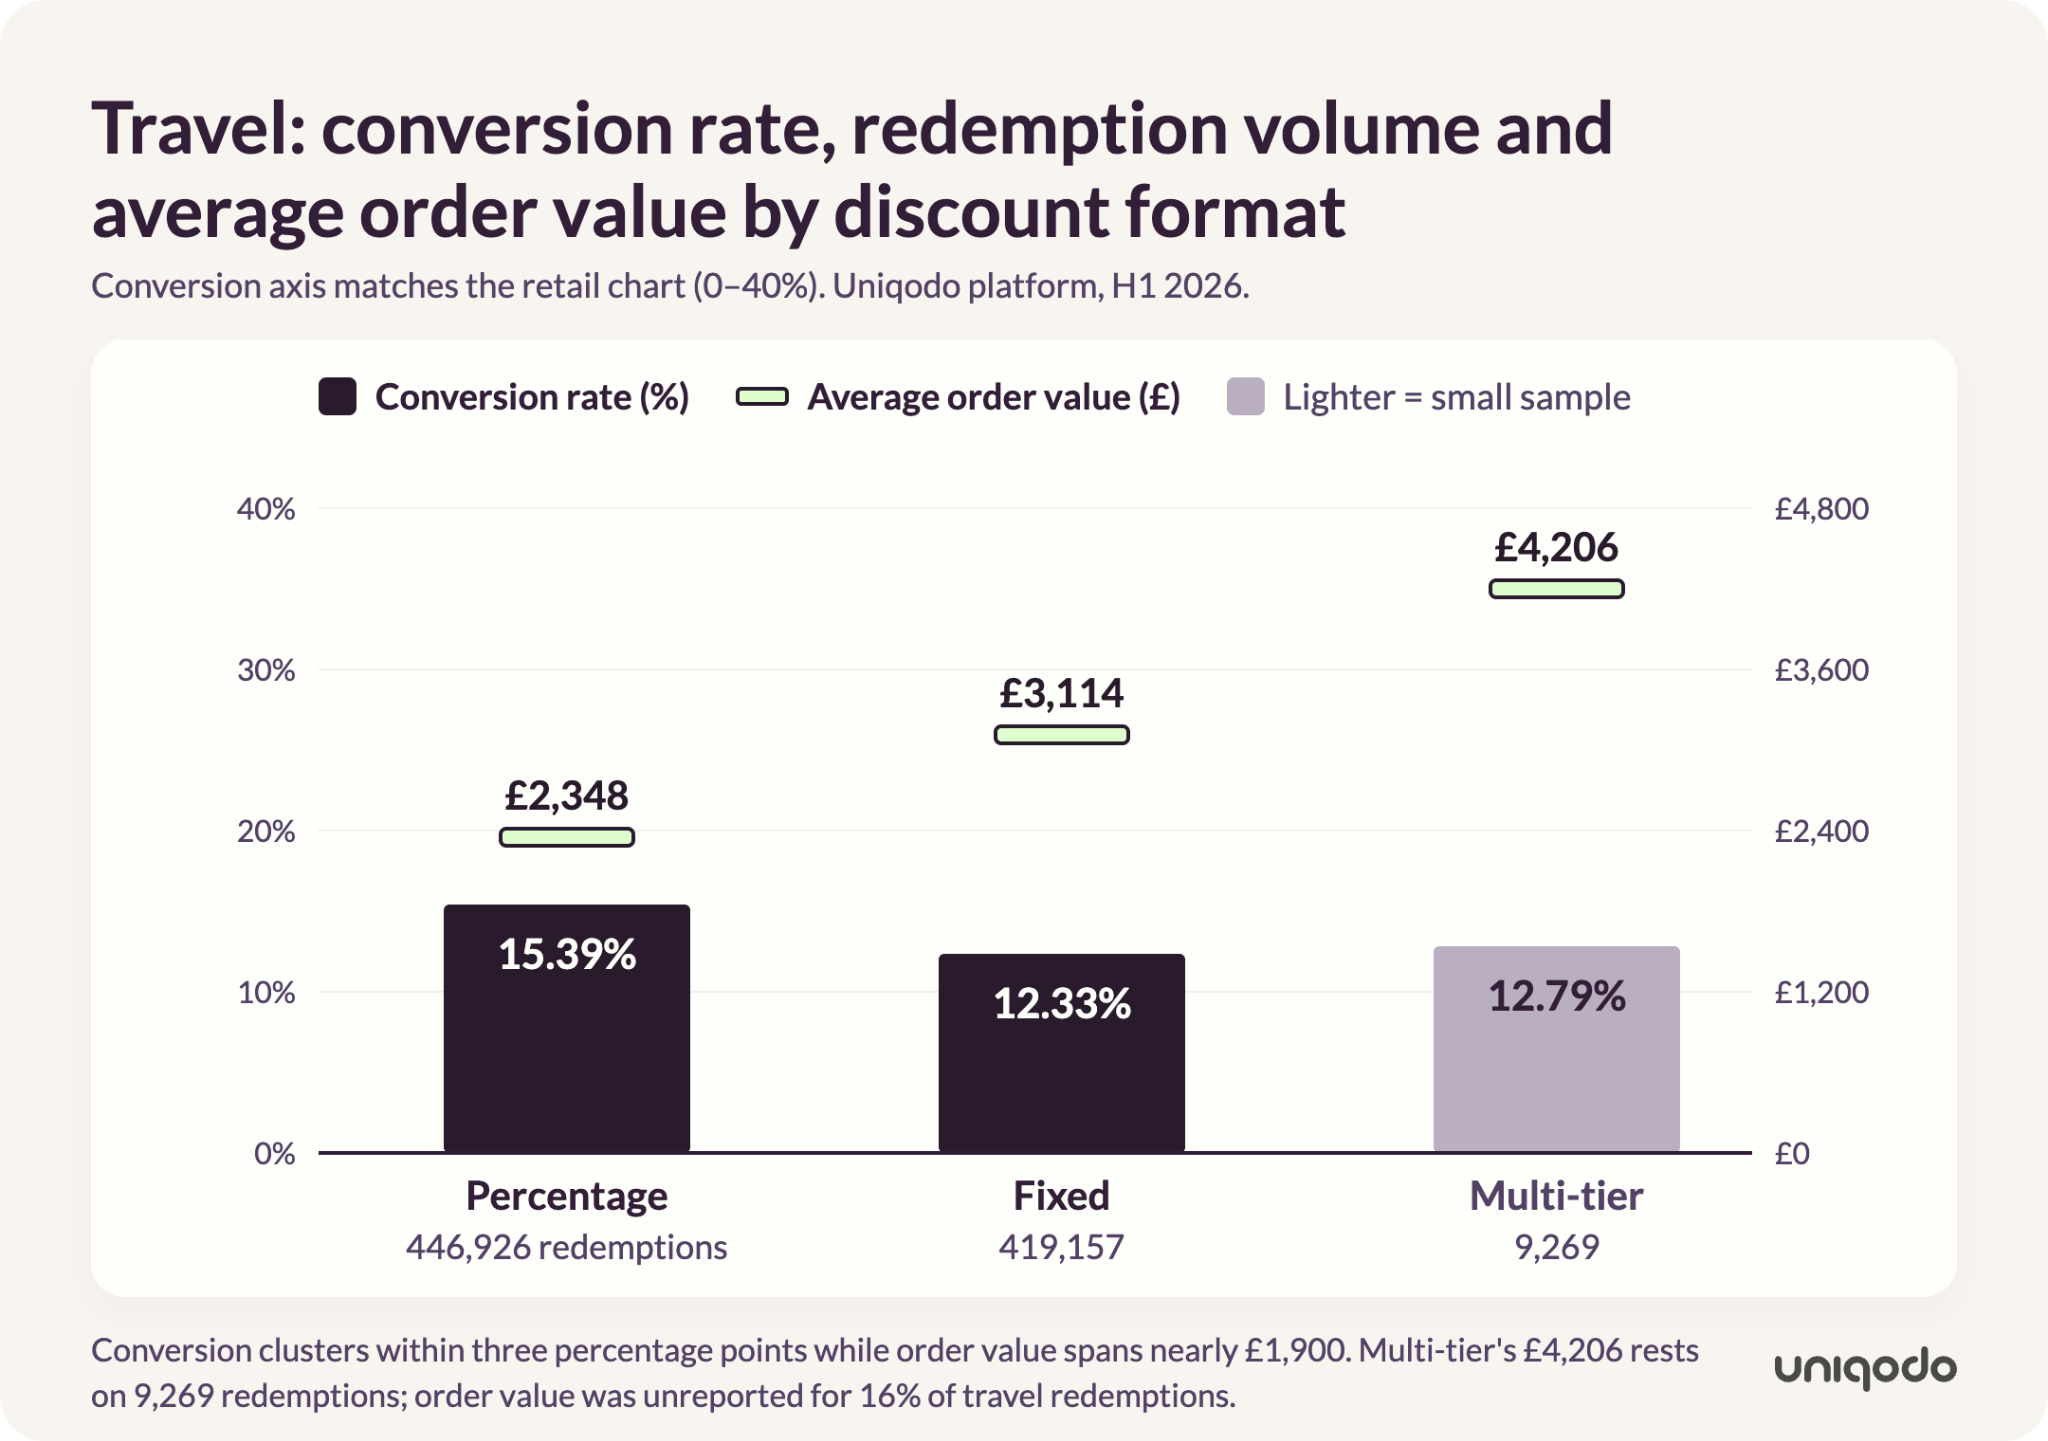
One reporting note: order value was unreported for 16% of travel redemptions, so the travel averages are calculated across revenue-bearing redemptions only. Conversion rates are unaffected.
A travel brand may accept a 12% redemption rate on validated codes in exchange for bookings worth more than £3,000, depending on its margin economics. The same conversion rate would warrant closer scrutiny in fashion. This difference shows why copying a competitor's discount strategy from another vertical can produce a poor fit.
Which Discount Type Works Best in Telco?
Fixed discounts converted better in telco than any other sector and format pairing on the platform, redeeming 41.07% of validated codes in H1 2026. This was the highest conversion rate in the dataset.
Two caveats apply to that figure. First, order value was unreported for 98% of these redemptions, so the conversion rate cannot support any basket value or revenue claim. Second, these were substantial fixed discounts of £118 to £400 off consumer technology. The conversion rate can still be reported, but this data cannot establish the commercial return per redemption.
The rest of the telco results show how much performance varied by format:
- Multi-tier discounts converted 14.12% of validated codes at £2,743 per order across 7,410 redemptions.
- Percentage discounts converted 5.47% of validated codes at £29 per order, the lowest sector and format pairing in the dataset.
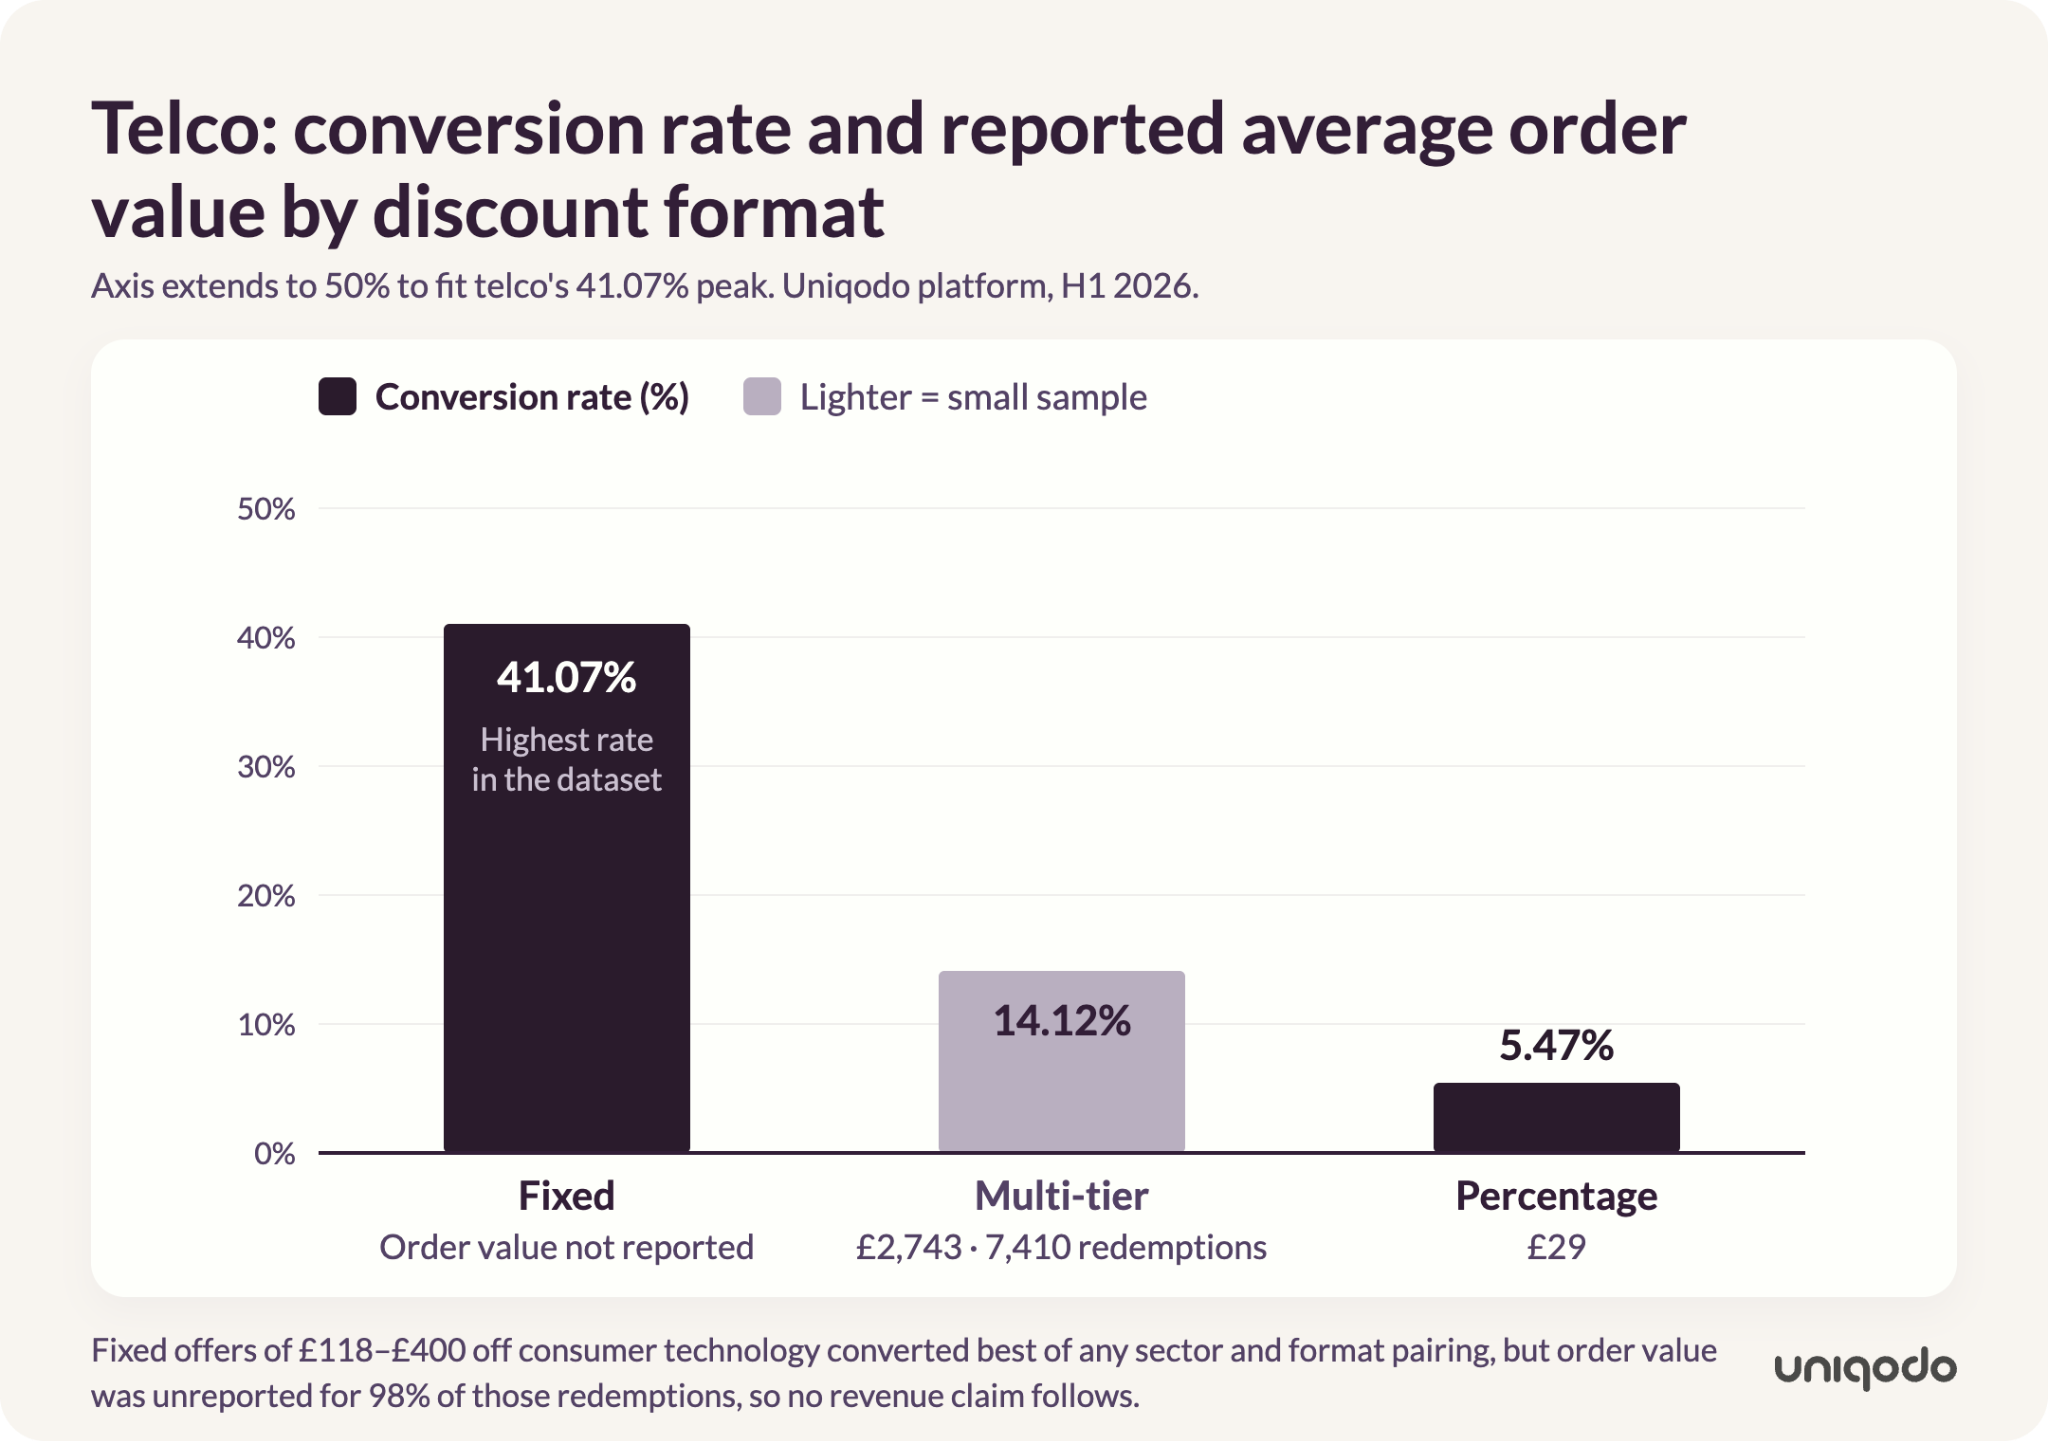
Telco average order values are calculated across revenue-bearing redemptions only, as order value was unreported for around a third of telco redemptions overall. Even with that qualification, the difference between a 41.07% redemption rate on fixed offers and a 5.47% rate on percentage offers provides a clear reason to test concrete fixed savings. A percentage discount on a complex contract price may be harder for customers to value than a specific pound amount.
How Do You Choose the Right Discount Format for Your Sector?
Start with one question: does your business win on conversion frequency or basket value? The H1 2026 data points towards conversion frequency for retail and fashion, basket value for travel, and concrete fixed savings for telco.
Use this short decision sequence:
- Name the commercial goal. Choose one primary objective per campaign: order frequency, basket value or offer clarity.
- Match the format to the goal. Frequency points to product and fixed discounts in retail. Basket value points to multi-tier and fixed discounts in travel. Offer clarity points to fixed discounts in telco.
- Check the volume behind any benchmark. Travel multi-tier's £4,206 average sits on 9,269 redemptions. Retail multi-tier's 31.64% conversion rate reflects concentrated adoption by one large merchant. Small or concentrated samples show what is possible, but they do not establish what is typical.
- Retest when the goal changes. A clearance campaign and an acquisition campaign in the same sector can justify different formats.
Tooling can create an operational barrier. If a platform-native promotion tool supports only one or two discount structures, every campaign may be forced into the same format. Uniqodo's Promotion Engine runs percentage, fixed, product and multi-tier discounts from a single rules engine. Teams can switch formats by sector, segment or campaign goal without rebuilding promotion logic each time.
Tiered discounts are another format to assess. Uniqodo's Tiered Discounts capability rewards larger baskets progressively, for example, 10% off at £50, 15% at £100 and 20% at £150, instead of giving every shopper the same flat discount. The data shows why this structure warrants attention: multi-tier discounts were associated with the highest average order value in travel at £4,206 and, in at least one large retail implementation, converted 31.64% of validated codes at scale. For a wider primer on how tiered offers compare with BOGO, half-off and conditional mechanics, see Uniqodo's guide to the six main types of promotions.
FAQs
What are the four main types of discounts?
The four discount formats analysed here are percentage discounts, fixed-amount discounts, product-level discounts and multi-tier, or spend-threshold, discounts. Each suits a different goal. Percentage offers scale with basket size, fixed offers give a concrete saving, product discounts target specific lines, and tiered offers reward larger baskets progressively.
Is a fixed amount off or a percentage off a better deal?
A: It depends on the sector and basket size. In Uniqodo platform data from H1 2026, fixed discounts converted 36.71% of validated codes in retail and fashion, compared with 12.41% for percentage discounts. In travel, percentage discounts converted best at 15.39%, while fixed offers were associated with larger bookings at £3,114 per redemption.
What types of discounts do businesses offer customers?
Beyond the four core formats, businesses can run seasonal discounts, loyalty and member discounts, volume or bulk discounts, referral rewards, early-payment terms, and conditional offers such as free shipping thresholds. The match between the offer structure and its commercial goal matters more than the mechanic alone.
Which discount type has the highest conversion rate?
In Uniqodo's H1 2026 platform data, telco fixed discounts redeemed 41.07% of validated codes, the highest rate of any sector and format pairing. These were substantial offers of £118 to £400 off consumer technology. However, order value was unreported for 98% of these redemptions, so the figure cannot be tied to basket value.
Should every industry use the same discount strategy?
No. The same format can produce very different outcomes by sector. Fixed discounts converted 36.71% of validated codes in retail and fashion but 12.33% in travel, where they averaged £3,114 per redemption compared with £112 in retail. The data points towards conversion frequency for retail strategies, basket value for travel strategies, and concrete fixed savings for telco strategies.
About Uniqodo
Uniqodo is the Intelligent Promotion Experience Platform for enterprise ecommerce and marketing teams. Sitting above your existing stack, Uniqodo makes advanced promotional mechanics possible, from unique single-use codes and tiered discounts to partner distribution and referral programmes, while protecting margins and eliminating code leakage. Since 2014, the platform has generated more than one billion codes for brands including Samsung, BT, EE, Avis and Travelodge.

Jenna Tyler
Director of Customer Operations