

Measuring promotional effectiveness means working out what the promotion actually changed. That means separating sales you would have made anyway from genuinely incremental demand, looking at margin rather than revenue alone, and being able to trace redemptions back to the channel or partner that drove them.
Finance does not need another chart showing that revenue went up while an offer was live. The harder question is whether the promotion created profitable demand that would not otherwise have existed.
This guide looks at the metrics that help answer that question, how to match KPIs to the purpose of a campaign, how to attribute redemptions properly and how to use control groups to measure incrementality.
Why revenue alone can't measure promotional effectiveness
Revenue during a promotion always rises. That tells you nothing about whether the promotion was effective, because a discount applied to a customer who would have purchased at full price is simply lost margin.
Four effects sit inside every promotional revenue spike and only one of them is genuinely incremental:
- Baseline sales. Your regular sales volume that would have happened without any offer. Discounting these customers is the cost of subsidy, and it is usually the largest hidden cost in any campaign.
- Forward buying. Customers stocking up at the discounted price, which suppresses full-price sales in the weeks after the promotion ends. Measure the post-promotion dip, not just the in-promotion lift.
- Cannibalisation. Volume pulled from your own adjacent products or from a full-price channel into the discounted one.
- True incremental volume. New customers, category expansion and volume won from competitors. This is the only portion that justifies the discount investment.
If your reporting shows revenue lift without separating these effects, you are presenting gross activity, not promotional effectiveness. Every section below exists to isolate that fourth effect.

Which promotion metrics measure effectiveness, not activity
Effective promotion tracking starts with margin, not revenue. A campaign that grows topline while shrinking contribution has made the business smaller, and blended revenue figures hide exactly that outcome. If margin protection is a live concern for your team, our guide to building a coupon marketing strategy that stops margin leakage pairs well with this one.
Two of these deserve particular attention.
- Margin contribution per promotion is the number Finance actually wants, and it requires you to include the costs that are hard to attribute: partner commission, gifted stock in a gift with purchase campaign, media spend supporting the offer and the operational cost of fulfilment.
- Promotional cost as a percentage of revenue is your promotion efficiency ratio, and tracking it quarter on quarter shows whether you are buying growth at a stable price or an escalating one.
Set promotion KPIs that match the campaign objective
An acquisition offer and a retention offer are not judged on the same number. Grading every campaign on revenue lift is how genuinely effective promotions get cancelled and margin-eroding ones get renewed.
The discipline matters at the planning stage, not the reporting stage. If a basket recovery offer is judged on recovered margin, you will notice quickly when the discount depth needed to convert exceeds the margin recovered. Uniqodo customers running basket abandonment recovery campaigns typically define this threshold before launch so the campaign has a clear pass or fail condition.
How redemption-level attribution makes channel performance measurable
Unique single-use codes turn attribution from a modelling exercise into a counting exercise. When every partner, influencer, email segment and paid channel receives its own pool of codes, each redemption is a verified fact tied to one source. There is no last-click guesswork, no attribution model to defend and no dispute about which partner drove which sale.
This solves the most common failure in tracking success of promotions: the shared generic code. When one code circulates across affiliates, coupon sites and social posts, the redemption data attributes everything to wherever the customer last saw it, which is usually a coupon aggregator rather than the partner who influenced the purchase. That spread is coupon code leakage, and it corrupts the measurement as much as it costs margin. Unique code pools per channel eliminate that distortion at source.
Redemption-level data provides insights into:
- Which specific partners and influencers drive redemptions, and at what margin, so commission budgets flow to genuine performers
- How a channel-specific offer performs, since a 15% code in email and a 10% code in paid social are separately measurable rather than blended
- Whether a channel drives new customers or resells to your existing base
Uniqodo Code Distribution issues and manages these unique code pools per partner or segment, giving each channel its own measurable identity. For the mechanics of why single-use codes outperform tracking links for partner attribution, see our article on unique codes as the future of affiliate tracking.
How do you measure incrementality with control groups?
A control group is a segment of eligible customers who are deliberately held back from the offer, so their behaviour shows what would have happened without it. The difference in purchase rate, margin and frequency between the exposed group and the control group is therefore your incremental effect.
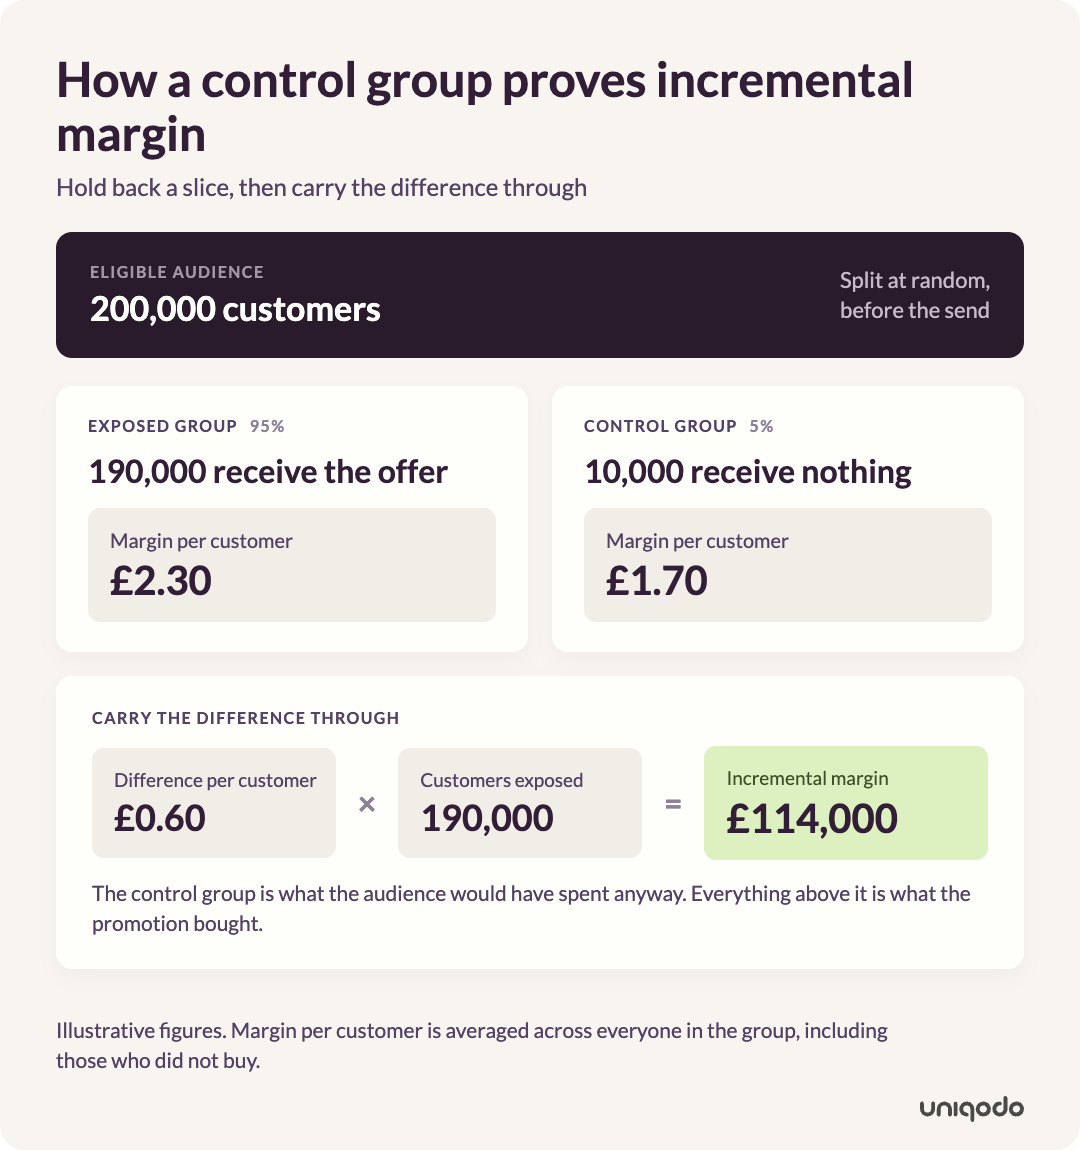
This is the single technique that separates rigorous promotional measurement from optimistic reporting, and it is the answer to the question Finance is really asking: would these sales have happened anyway?
Run it in four steps:
- Define the eligible audience first. Everyone who would qualify for the offer, before any exposure decision is made. Randomise the split so the two groups are statistically comparable.
- Hold back a control segment. Typically 5-10% of the audience sees no offer at all. On a large audience this is enough to produce a reliable baseline without sacrificing meaningful revenue.
- Test discount depth, not just presence. A second variant receiving a shallower discount (10% against 20%, for example) tells you whether the extra depth bought extra conversion or just gave margin away. In many campaigns the shallower offer converts nearly as well, and that finding alone can fund the measurement programme.
- Compare margin per customer across groups over a full window. Include the post-promotion period to capture forward buying. A promotion that wins the two-week window and loses the eight-week window has pulled demand forward, not created it.
The same experimental structure extends to offer format and timing. Testing a percentage discount against a gift with purchase variant, or a seven-day window against a fourteen-day one, uses identical randomised splits. Shorter promotional periods frequently deliver most of the volume of longer ones at a fraction of the subsidy cost, but only a controlled test proves it for your customer base. Our guide to A/B testing in ecommerce covers the statistical guardrails.
Control groups require the ability to segment eligibility at the point of redemption, which is why they are rare among teams running promotions through basic native discount tools. Uniqodo's advanced reporting and eligibility controls are built for exactly this: defining who can redeem, holding back segments and reading the difference in the redemption data.
Design promotional measurement in before launch
Promotional measurement fails most often because it is reconstructed after the fact. The reliable version is built in before a single code is issued, and it follows a four-step sequence.
- Define what ROI means for this promotion. Agree the full cost base up front: discount value, partner commission, media support, gifted stock and fulfilment. Agree the return side too, whether that is first-order margin or expected customer lifetime value for acquisition campaigns.
- Set the KPI to the objective. Use the objective-to-KPI mapping above and write down the pass threshold before launch. A campaign without a pre-agreed success condition cannot fail, which means it cannot teach you anything either.
- Build the tracking before the campaign goes live. Unique code pools assigned per channel, control segments defined, reporting ready to capture redemption data from launch. If the measurement infrastructure is not live at launch, the first week of data (usually the most active) is lost.
- Use unique single-use codes as the measurement mechanism. They are simultaneously the fraud control and the data source. Every redemption carries its channel, its customer and its order detail.
The Uniqodo Promotion Engine handles this at the infrastructure level: eligibility rules define who can redeem and under what conditions, and every redemption carries its channel, customer and order detail. Once integrated, marketers self-serve campaign setup, so measurement discipline does not depend on a development queue.
For a wider view of what to look for in this category, see our comparison of the best promotion engine software.
How should you report promotional performance to Finance?
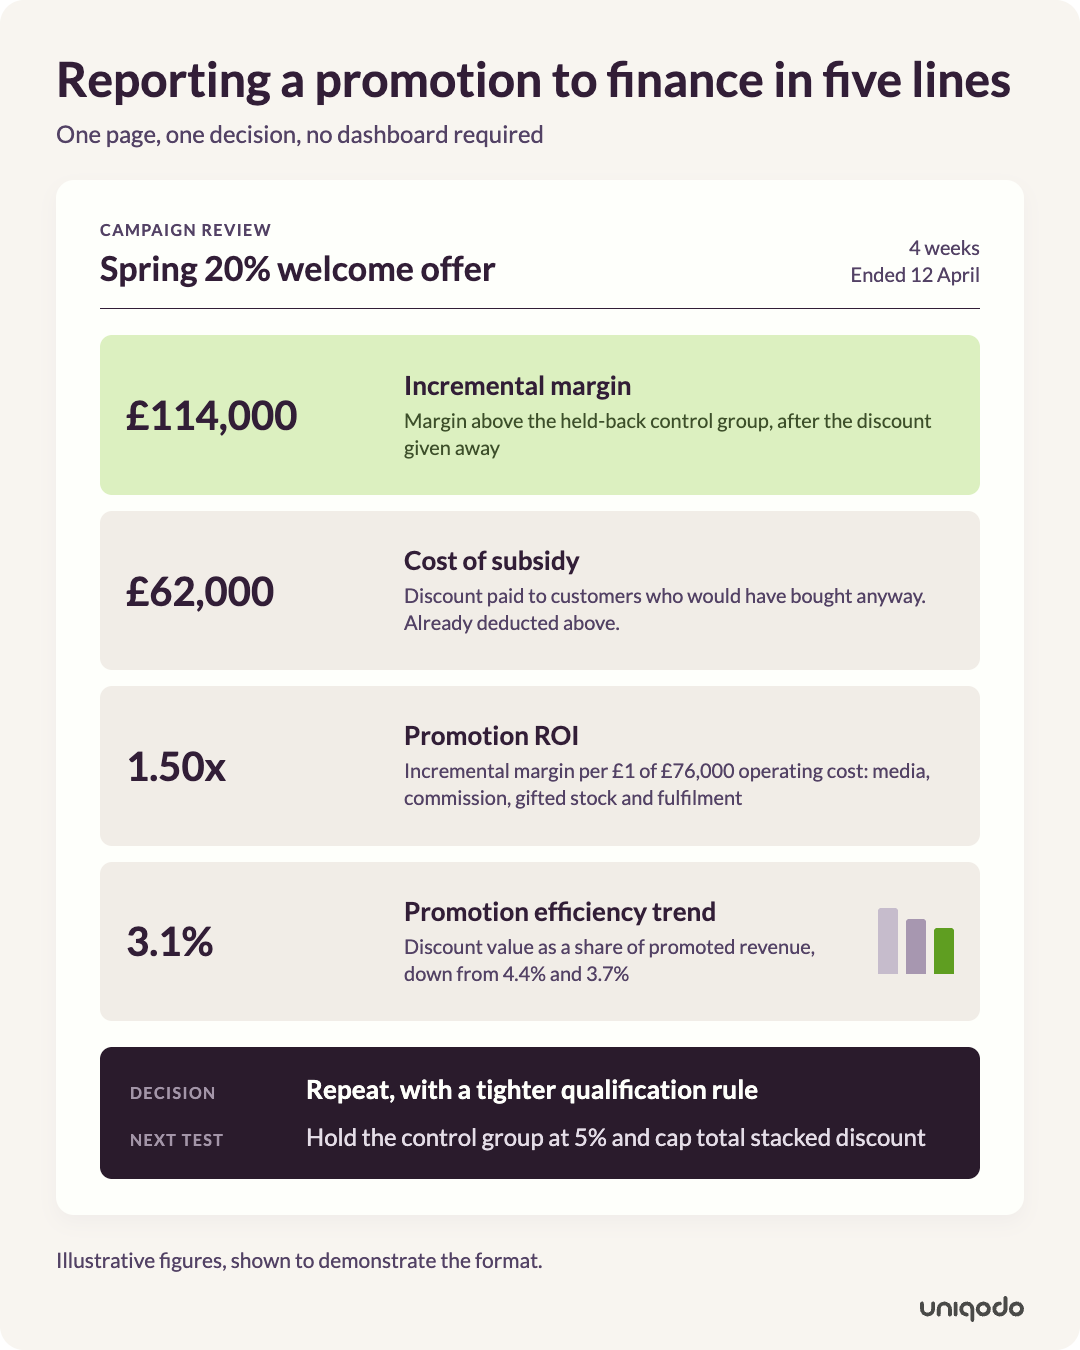
Report incremental margin, not revenue lift. Finance approves budgets on evidence that the promotion generated contribution the business would not otherwise have earned, and a one-page format per campaign gets that decision made faster than a dashboard ever will.
Structure the page around five lines:
- Incremental margin: exposed group margin minus control group margin, multiplied across the audience. This is the headline number.
- Cost of subsidy: discount value given to customers the control group suggests would have purchased anyway. Reporting this yourself, before Finance asks, is what builds credibility.
- Promotion ROI: incremental margin divided by total promotional cost, with the full cost base from your pre-launch definition.
- Promotion efficiency trend: promotional cost as a percentage of revenue against the previous quarter, showing whether growth is getting cheaper or more expensive to buy.
- Decision and next test: renew, adjust depth or retire, plus the variant you will test next.
Trade promotion effectiveness measurement in CPG has run on this baseline-and-incrementality logic for decades. Ecommerce teams have an advantage those businesses never had: redemption-level first-party data that makes the incremental calculation direct rather than modelled.
Common promotional measurement mistakes
Most measurement failures repeat across teams and all of them are avoidable at the design stage.
- Last-click attribution on shared codes. One generic code across all channels credits whichever touchpoint came last, systematically overvaluing coupon aggregators and undervaluing the partners who created demand.
- Judging campaigns on revenue lift alone. Revenue always spikes during a promotion. Without margin contribution and a control comparison, the spike proves activity, not effectiveness.
- Measuring only after the fact. Reconstructed measurement inherits whatever gaps exist in the data. Tracking built before launch captures the complete picture.
- Ignoring the post-promotion window. Forward buying means the honest measurement period extends weeks beyond the campaign end date.
- Applying one KPI to every objective. Acquisition, retention and basket recovery campaigns answer different questions and need different numbers.
- Uncontrolled coupon stacking. Multiple offers applying to one order makes per-campaign cost unmeasurable. Our glossary entry on coupon stacking rules and controls explains how to prevent it.
Fixing measurement usually surfaces improvement opportunities in the promotions themselves. Our piece on 7 ways to improve promotional effectiveness is the natural next read once your reporting is in place.
Promotional Effectiveness Measurement FAQs
How do you measure marketing effectiveness?
Measure marketing effectiveness by comparing outcomes against a baseline of what would have happened without the activity. For promotions specifically, that means tracking incremental margin through control groups, attributing redemptions to channels with unique codes and monitoring promotional cost as a percentage of revenue over time.
What are the most important promotion metrics?
The five that matter most are margin contribution per promotion, redemption rate, average order value impact, new versus returning customer split and promotional cost as a percentage of revenue. Margin contribution is the primary metric because revenue lift alone cannot distinguish incremental sales from subsidised ones.
How do you calculate ROI on a promotion?
Promotion ROI is incremental margin divided by total promotional cost. Incremental margin is the difference between the exposed group and a control group that saw no offer. Total cost includes the discount value, partner commission, media support and fulfilment, not just the face value of the discount.
How do you calculate ROI on a gift with purchase promotion?
Treat the gifted item at its cost price, not retail price, and add fulfilment. ROI is the incremental margin from qualifying orders (versus a control group) divided by total gift cost plus supporting spend. GWP campaigns often outperform percentage discounts because the perceived value exceeds the actual cost of the gift.
What is promotion effectiveness analysis?
Promotion effectiveness analysis is the process of separating a promotion's incremental impact from baseline sales, forward buying and cannibalisation. It combines redemption-level attribution, margin calculation and control group comparison to produce a decision-ready ROI figure for each campaign rather than a blended revenue view.

Kate Forknell
Head of Product